








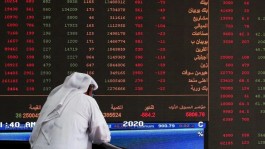

























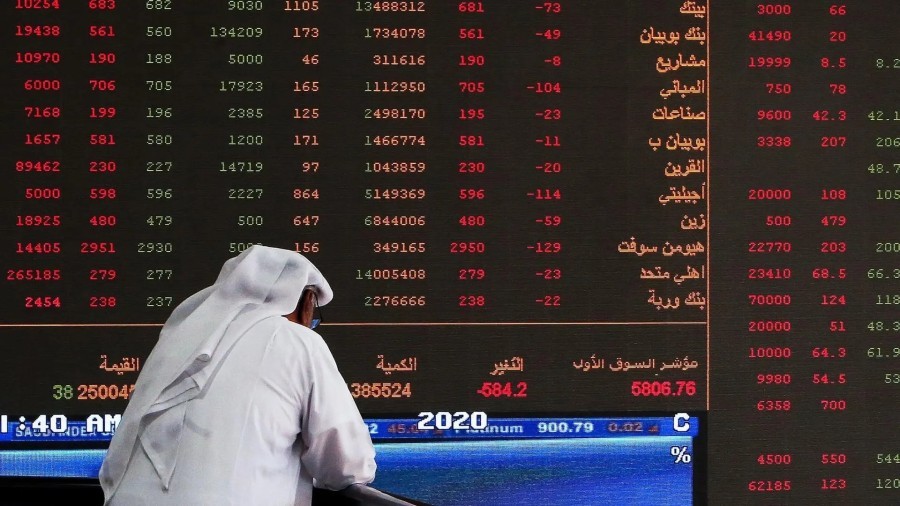


The Saudi Tadawul All Share Index (TASI) fell on Tuesday to 10,490.51 points (-0.84%, -88.67 points), within a daily range between 10,485.81 and 10,588.24 — close to its 52-week low of 10,193.83. This decline does not reflect a direct Saudi news event, but rather a broader global pressure: the yield on the 10-year US Treasury note jumped to 5.25-5.27% — its highest level since 2007 — after only reaching 5.17% on Friday, coinciding with losses on Wall Street and rising oil prices. This pressure was reflected across Asian markets: Japan's Nikkei -1.2%, South Korea's Kospi -0.6%, Hang Seng -0.5%, and Shanghai -1%.
The fundamental paradox: The rise in oil — which usually supports Aramco and the Saudi energy sector — did not help the Tadawul All Share Index (TASI) this time, because it fuels inflationary fears that raise expectations of a tightening of the Federal Reserve, thus putting pressure on stock valuations globally, regardless of any local oil catalyst.
Full technical analysis (WarrenAI, hourly timeframe)
sharp downward pressure
TASI is trading at 10,490.77 points according to the latest screenshot (1:49 PM Saudi time), and the trend on the hourly timeframe is strongly downward, but the index is approaching an oversold zone that may produce a temporary rebound.
| Index | Reading | Significance |
|---|---|---|
| SMA (20 hours) | 10,593.28 | Price below — Sellers in control |
| SMA (50 hours) | 10,672.78 | The price is below by a wider margin |
| RSI | 25.64 | Oversold zone (does not confirm a bottom, but increases the likelihood of a short bounce) |
| ADX | 38.19 (with -DI at 46.66 versus +DI at 12.95) | A strong downtrend indeed, not a sideways pullback |
Additional signal : Breakout of the bearish flag pattern near 10,566 points, with a close near the lows and the price trading below the lower Bollinger Band (~10,488.78).
Critical levels
First resistance : 10,593 (near 20-hour SMA)
Pivot resistance : 10,606 (SuperTrend) — Recovering it may ease the pressure
Stronger resistance : 10,672.78 (SMA50 hours)
First support : 10,485.95 (apparent local low)
Next support level : 10,432 (127.2% Fibonacci extension)
Deeper support : 10,350 (psychological and technical support)
Surveillance scenarios
| The scenario | Activation | Goals | trust |
|---|---|---|---|
| Continued decline | Hourly closing below 10,485.95 | 10,432 then 10,350 | Medium (RSI is oversold) |
| Artistic bounce | Recover 10,593 then 10,606 | 10,672.78 | Low (ADX and DI- are still negative) |
| Lateral oscillation | Between 10,485.95 and 10,593 | No clear objective | Low |
Summary
Key takeaway: The picture remains negative as long as the index stays below 10,606. A break below 10,485.95 could open the way towards 10,432, while a return to the 10,593-10,606 range would be the first sign of easing pressure. The overbought RSI and the price approaching the lower Bollinger Band could support a quick bounce, but this bounce is unlikely to become a true trend reversal until the pivotal resistance is breached—the downward momentum (ADX) remains high.