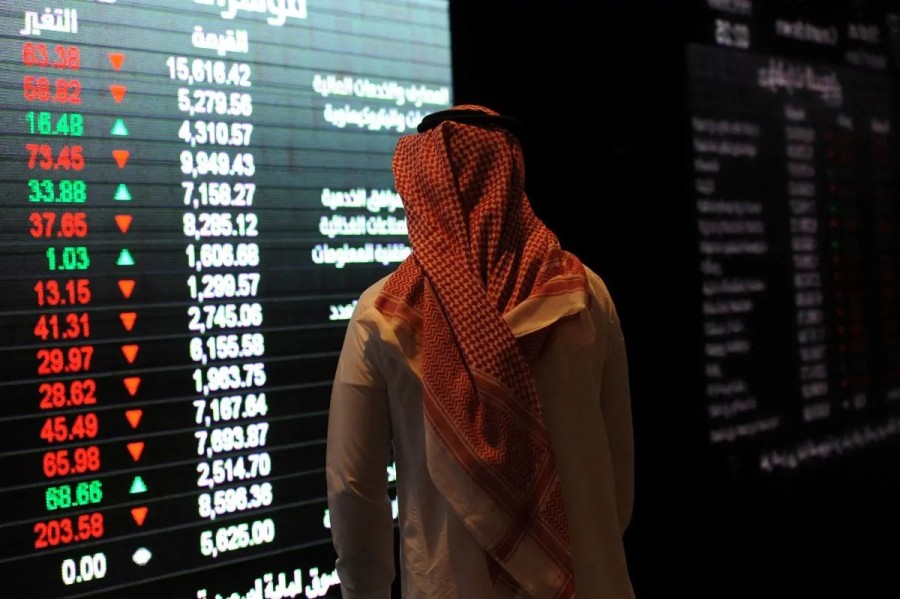
The Saudi stock market's main index, TASI, jumped to 11,718.99 points on Wednesday, gaining 0.4% and continuing to trade above its 200-hour moving average, indicating a stable short-term uptrend. However, the technical picture appears complex, as data points to strong overbought conditions across all technical indicators, reflecting a real struggle between the continuation of the upward momentum and the possibility of an imminent technical correction.
Although the index's annual return remains negative at -2.8%, the total trading volume of approximately 139.78 million shares confirms continued buying activity and a robust risk appetite among traders. This indicates that the market is currently navigating a delicate balance between confidence and caution, requiring careful analysis of technical data and money flow.
This data comes from the WarrenAI platform, available through InvestingPro subscription, which is one of the leading advanced analysis tools in financial markets. It combines artificial intelligence and quantitative analysis to provide an immediate reading of market trends, giving investors decisions based on accurate data and real-time analysis.
Exceptional technical momentum and warnings of overbought conditions
Technical indicators — the Relative Strength Index (RSI), Moving Average Convergence Divergence (MACD), and Average Directional Index (ADI) — indicate significant buying power in the market, with the RSI reaching 69 points and the Stochastic and Stochastic RSI approaching the 100 level, suggesting that the market has reached high overbought levels that warrant caution.
The short-term and long-term moving averages, from 5 to 200, all provide a simultaneous buy signal, reinforcing the upward trend, but also increasing the likelihood of a short-term technical pullback if the momentum weakens. Furthermore, the drop in the intraday rate of change to 19.92 reflects a slowdown in price action despite the continued upward movement in recent days.
According to WarrenAI's analysis, the general index is approaching a significant resistance at 11,750 points, an area the market has tested several times before without being able to break through, making it a pivotal point that will determine the extent to which buyers can continue to support the upward trend during the coming sessions.
Key support and resistance levels
The data indicates that the nearest major resistance is at 11,750 points, the most significant technical barrier preventing further gains. On the downside, the strongest support is at 11,448 points, close to the 200-day moving average, making it a crucial defensive level against any potential pullback.
The market is moving within a narrow range between 11,600 and 11,800 points, meaning that a clear breakout from either of these levels would likely trigger a sharp move in the same direction. If the index successfully overcomes the resistance, it is expected to reach new highs; however, if it breaks the support, a technical correction is likely.
The WarrenAI platform allows investors to track these levels in real time through its smart tools that automatically generate entry and exit signals, and provides instant alerts when the technical trend changes, giving investors a strategic edge in a fast-moving trading environment.
Between the heat of the moment and the apparent calm of the market
Although momentum indicators remain positive, the rapid rise in buying signals raises concerns that the market may be entering a short-term correction phase. Overbought signals are typically preceded by profit-taking aimed at rebalancing and restoring momentum before the upward trend resumes.
WarrenAI analysts believe that if the index fails to break above 11,750 points, it could fall back towards 11,450 points, while a successful break above resistance could usher in a new phase of upward momentum. The analysts emphasize that continued foreign inflows are a key support factor, but any fluctuations in oil prices or disruptions in global markets could quickly reverse the trend.
In conclusion: The decision rests with the calm investor.
The current market landscape in Saudi Arabia is highly attractive to professional investors, but it demands discipline and composure in decision-making. While the upward trend remains intact, ignoring technical overbought indicators could lead to unexpected short-term losses.
WarrenAI recommends closely monitoring the index's behavior at the 11,750 level, accurately setting stop-loss orders below key support levels, and avoiding excessive entry into long positions until the next trend is confirmed.
