


Probably more money is being traded today using moving averages than with all other technical indicators combined. They are very simple to calculate, and can be used for everything from finding very long term monthly trends to setting stops for day trading, and also for determining solid entry and exit points in the market.
Moving averages smooth out market fluctuations and short-term volatility to give the trader some idea of which way the market is going. That in itself is a useful tool for any trader, but they offer much more information.
A moving average is an indicator that shows the average value of a security's price over a period of time. When calculating a moving average, a mathematical analysis of the security's average value over a predetermined time period is made. When calculating a moving average, you specify the time span to calculate the average price (e.g., 25 days). As the security's price changes, its average price moves up or down.
A simple moving average is calculated by adding the security's prices for the most recent n time periods and then dividing by n. For example, adding the closing prices of a security for most recent 25 days and then dividing by 25. The result is the security's average price over the last 25 days. This calculation is done for each period in the chart.
Interpretation
The most popular method of interpreting a moving average is to compare the relationship between a moving average of the security's price with the security's price itself. A buy signal is generated when the security's price rises above its moving average and a sell signal is generated when the security's price falls below its moving average.
This signal is generated because it is considered that the moving average line is a strong level of support or resistance the price. The price should bounce off the moving average. If it does not, and breaks through, then it should continue in that direction until it finds a new level to rest at.

Short term moving averages tend to generate more buying/selling signals. However, some of them are false.

Long term moving averages tend to be more reliable and generate fewer entry signals. However, as the move may be well under way, before the signal is generated, a substantial part of the move may be missed.

Multiple Moving Averages
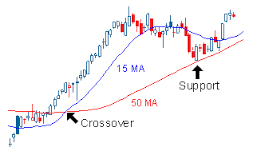
Moving averages can become more powerful when more than one is plotted on the same chart. We would use one long term average (for example 40 day) and one short term average (for example 20 day). These are used separately from the actual price action of the product we are charting. A buy signal would be generated when the short-term average moves above the long-term average line if both lines are directed upwards. A sell signal would be generated when the short-term average moves below the long-term average line if both lines are directed downwards.
|
Moving averages only work well in trending markets. When a market fluctuates in a narrow trading channel, moving average generate only false signals. |
|
|